The RPG Office Condominium Report
Second Half 2018 Office Condominium Sales
- A Market Breather: After a robust first half of 2018, there was an expected slide in the velocity of office condominium sales in the second half of the year. The total square footage sold in the second half of 2018 was 54% less than the first half of the year, and the total dollar value of sales was 56% less.
- Pricing Remains Strong: In the second half of 2018, the average price per square foot was $901. The average price per square foot was 15% higher than the five-year average of $786.
- The Downsides of Amazon: The insatiable demand for office space from Amazon, Google, Facebook and others is making it difficult for businesses to survive. With large corporate tenant expansions, availability rates are shrinking and rents are spiking, resulting in smaller businesses being squeezed out. Purchasing an office condominium is the best way for businesses to retain a Manhattan presence while benefiting from the long-term increase in value created by the strength of the office market.
Market Overview
The Manhattan office condominium market is made up of 99 buildings, occupying a total of 10.9 million square feet. The Midtown submarket is comprised of 6 million square feet; Midtown South is comprised of 2.8 million square feet; Downtown is comprised of 2.1 million square feet. There are 3.4 million square feet of class A office condominiums, 5.4 million square feet of class B, and 2.1 million square feet of class C.
In the second half of 2018, there were 116,750 square feet of office condominium sales in Manhattan, totaling $105,155,720. The sales averaged $901 per square foot. There were a total of 19 office condominium units sold in 13 different buildings, averaging 6,145 square feet per sale.
The total square footage of sales was significantly lower in the second half of 2018 compared to the first half of 2018, with 116,750 square feet sold in the second half of 2018 and 253,174 square feet in the first half of 2018. The total square footage of sales in the second half of 2018 is also considerably lower than the five-year average of 200,286 square feet per half year.
In the second half of 2018, there was a total of $105,155,720, which is less than half of the dollar of sales in the $934 per square foot average in the first half of 2018. The dollar value of sales is 33% less than the five-year average of $157,342,613.
In the second half of 2018, the average price per square foot was $901. Pricing was lower than the first half of 2018, but still significantly higher than the five-year average of $786.
There were 19 sales in the second half of 2018 compared to 34 sales in the first half of 2018. The number of office condominiums sold in the second half of 2018 was also lower than the five-year average by 9 sales.
The Midtown submarket is Manhattan's largest office condominium submarket, comprising approximately 6 million square feet. In the second half of 2018, there were 11 sales totaling 82,420 square feet. The dollar value of these sales totaled $75,382,720, averaging $915 per square foot.
The Midtown South submarket comprises approximately 2.8 million square feet of office condominiums. In the second half of 2018, there were 5 sales totaling 17,596 square feet. The dollar value of these sales totaled $16,865,000, averaging $958 per square foot.
The Downtown submarket comprises approximately 2.1 million square feet of office condominiums. In the second half of 2018, there were 3 sales totaling 16,734 square feet. The dollar value of these sales totaled $12,908,000, averaging $771 per square foot.
There is 886,836 square feet of available Manhattan office condominiums, which equates to an 8.1% availability rate. A total of 89 units are for sale in 44 buildings, with an average asking price of $1,014 per square foot. In the Midtown submarket, there is 610,578 square feet for sale with an average asking price of $1,043 per square foot. In the Midtown South submarket, there is 102,484 square feet for sale with an average asking price of $968 per square foot. In the Downtown submarket, there is 173,774 square feet for sale with an average asking price of $938 per square foot. The availability rate has increased by 0.7% from the first half of 2018.
In the second half of 2018, there were 127,312 square feet of office condominium sales in Manhattan totaling $115,648,278. There were 22 office condominium sales, averaging 5,787 square feet per sale, at an average of $908 per square foot.
Market Overview (continued)
Square Footage of Sales: The 127,312 square feet sold in the second half of 2018 is 50% lower than the 252,908 square feet sold in the first half of 2018 and 47% lower than the five-year average of 239,186 square feet sold. Out of the 22 sales, the smallest sale was 1,410 square feet and the largest sale was 18,003 square feet.
Dollar Value of Sales: In the second half of 2018, office condominium sales totaled $115,648,278 which is 51% less than the $238,363,883 in sales for the first half of 2018. The dollar value of sales is 37% less than the five-year average of $182,935,213.
Average Price Per Square Foot: In the second half of 2018, the average price per square foot was $908. This is 4% lower than the first half of 2018 average of $942 per square foot and 19% higher than the five-year average of $765 per square foot.
Number of Sales: There were 22 sales in the second half of 2018, down 15 sales from the first half of 2018. The number of office condominiums sold in the second half of 2018 was 8 less than the five-year average of 30 sales.
Submarket Statistics
The Midtown submarket: In the second half of 2018, there were 10 sales totaling 52,622 square feet. The dollar value of these sales totaled $50,798,818, averaging $965 per square foot.
The Midtown South submarket: In the second half of 2018, there were 9 sales totaling 69,100 square feet. The dollar value of these sales totaled $59,091,460, averaging $855 per square foot.
The Downtown submarket: In the second half of 2018, there were 3 sales totaling 5,590 square feet. The dollar value of these sales totaled $5,758,000, averaging $1,030 per square foot.
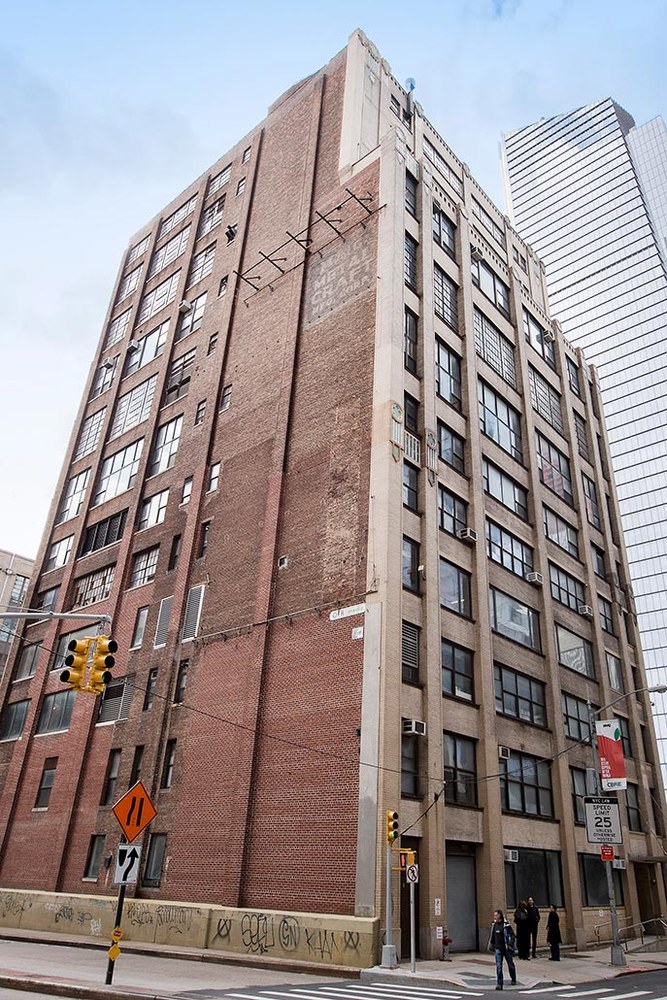
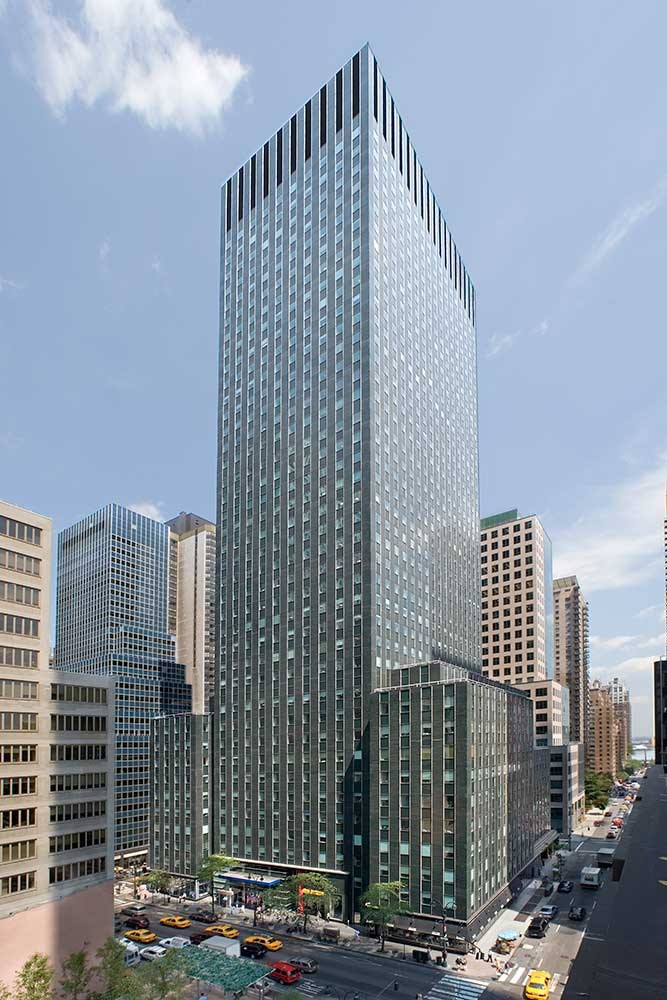
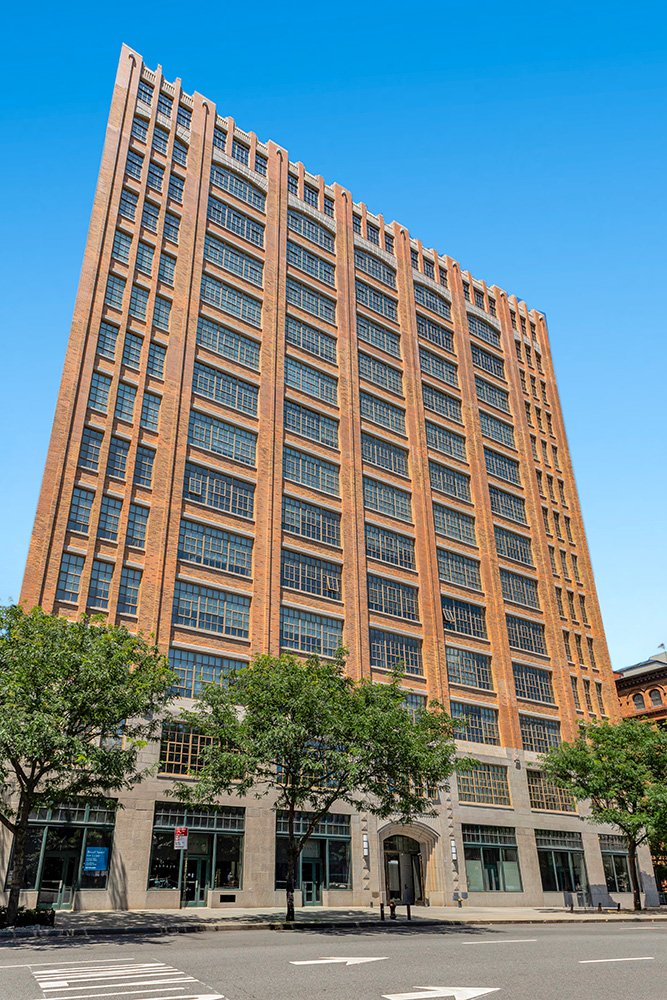
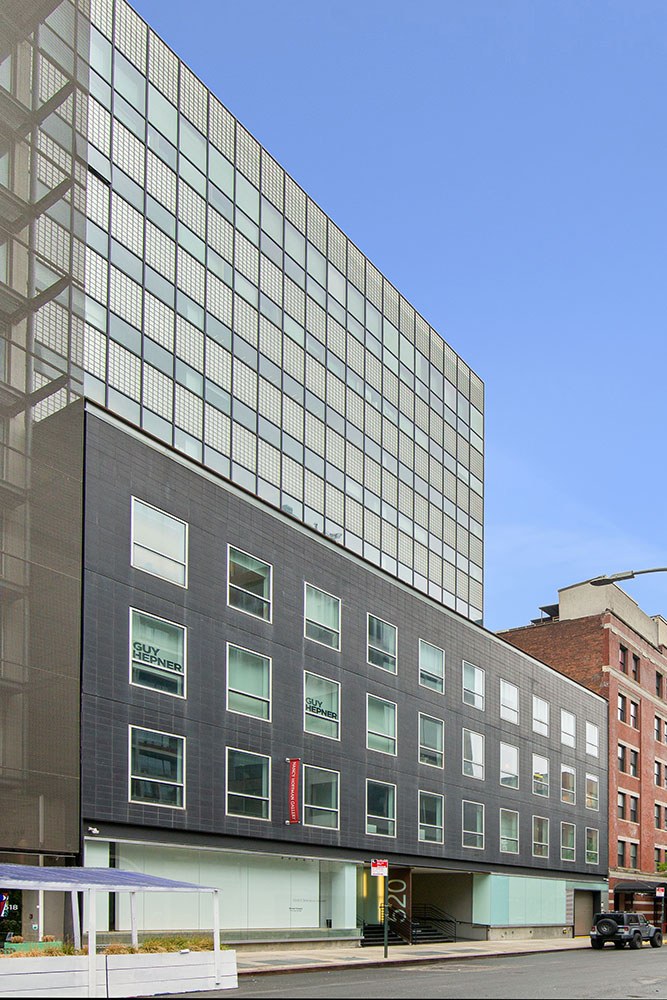
Notable Office Condominium Sales
Will Amazon's New Headquarters Kill Your NYC Business?
By Rudder Property Group
The 2018 Manhattan office leasing market experienced a record year with 33 million square feet of leasing activity. Corporate behemoths such as Google, JPMorgan Chase, Pfizer, Disney and Facebook have committed to millions of square feet of office space in Manhattan. Amazon's November announcement that Long Island City would be its second headquarters location added even more fuel to the already heated office market.
Brooklyn and Long Island City have long been considered a cost-efficient alternative to Manhattan's premium pricing. Now, with the five million square feet Amazon is expected to occupy, the boroughs may no longer be a low-cost option. With a decreased supply of office space, lease rates will inevitably increase, resulting in a ripple effect on all boroughs.
A recent report by JLL shows that in 2018, a record high of 129 leases were signed with a starting rent of $100 per square foot or more. These $100 per square foot leases occurred in 55 buildings, totaling 46 million square feet.
This prolonged strength of the Manhattan office leasing market is making it difficult for businesses to survive. As availability rates of quality office space shrink, rents are reaching towering prices and forcing out smaller businesses while large corporate tenants are expanding.
The Manhattan office market is expected to continue to fluctuate; however, if the general trend of corporate expansion continues, then we will likely see $100+ per square foot rents will likely become the norm rather than the outlier.
How can businesses protect themselves from getting priced out? The answer is to purchase an office condominium.
An office condominium offers businesses and organizations the opportunity to purchase their office space rather than rent. The annual cost of ownership is significantly less than leasing over a five- to ten-year period. By purchasing their space, unit owners are also protected from being displaced with ever-rising rents. Companies and organizations can then reap the long-term benefits of ownership, including control over space improvements, static expenses, and capital appreciation as values continue to rise.
Rudder Property Group
Rudder Property Group is a commercial real estate services firm that specializes exclusively in the sale of office condominiums in the New York metropolitan area. With 20 years of experience in this niche market, Rudder Property Group has sold over two million square feet of office condominiums with a dollar value in excess of $1 billion. In the small, highly specialized field of office condominium sales, Rudder Property Group is the market leader.
©2018 Rudder Property Group. All rights reserved. All material presented herein is intended for informational purposes only. While this information is believed to be accurate, it is represented subject to errors, omissions, changes or withdrawal without notice. All square footages are approximate and based on rentable square footages with standard Manhattan loss factors. For the purposes of this report, the definition of an office condominium is a building with more than two unit owners that has been constructed or converted to a condominium or cooperative for commercial use only. This report only includes properties in Manhattan below 96th Street.